
This is why the Mandelbrot sets are amazing!
Mandelbrot set is a special set of complex numbers that has fascinating properties. It consists of all complex numbers \( c \) for which the sequence \( z_{n+1} = z_{n}^{2} + c, z_{0} = 0 \) is bounded.
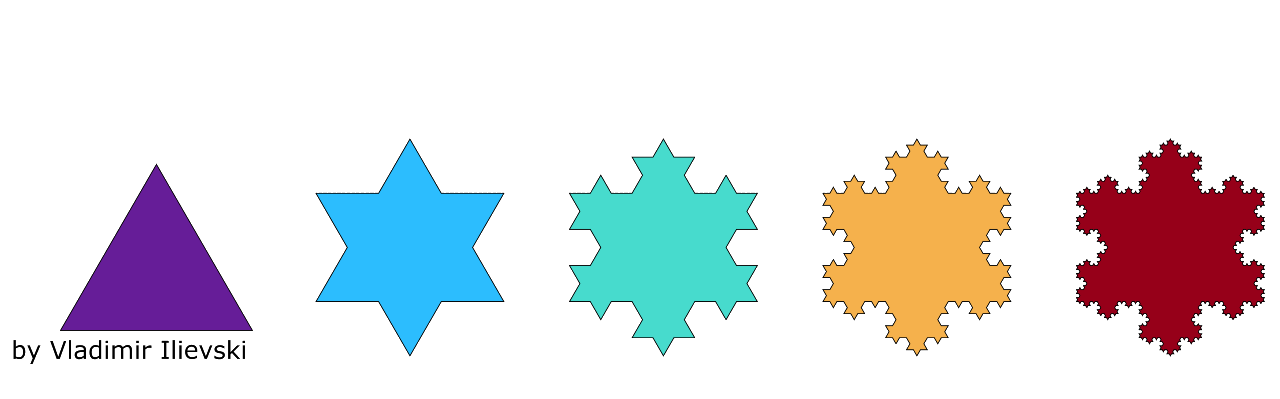
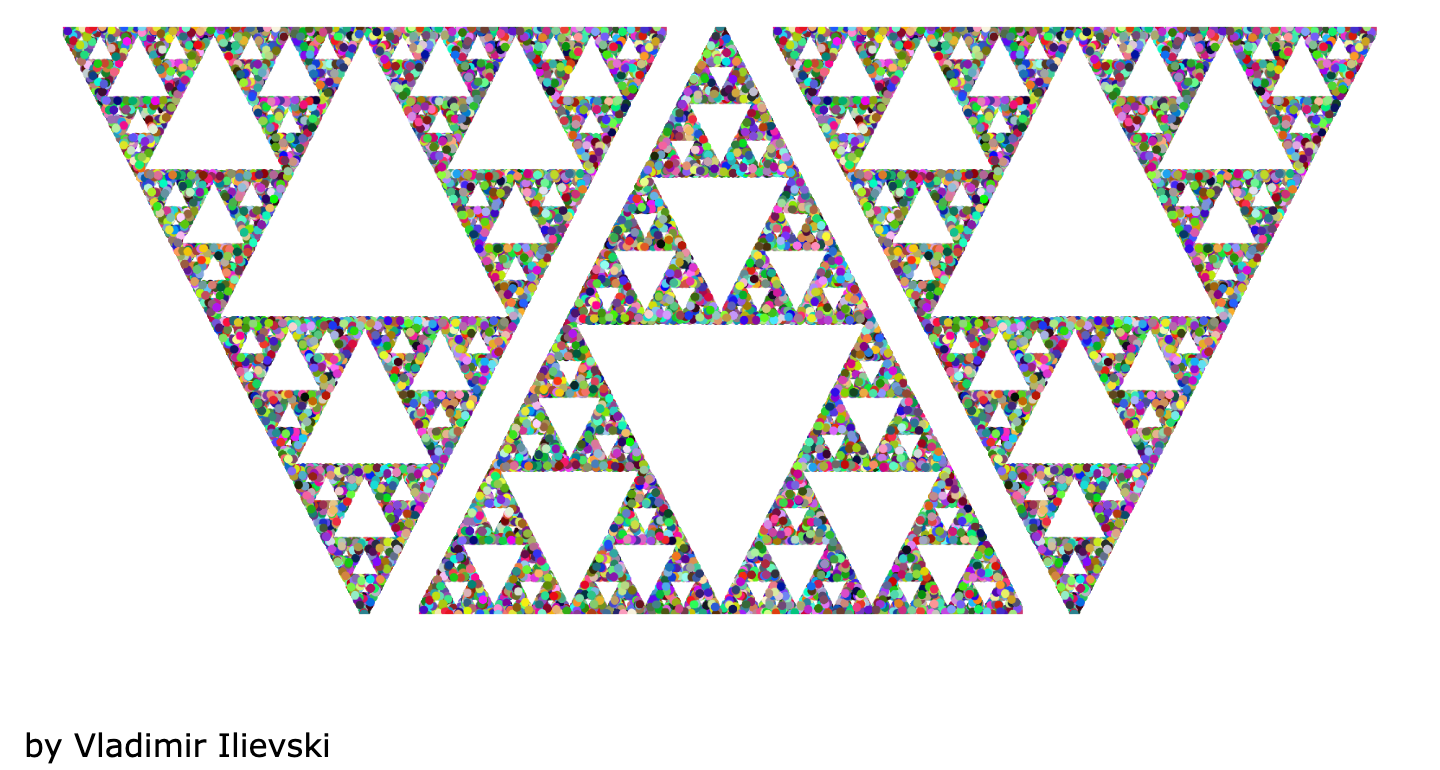
If we visualize all such complex numbers in the complex plane, such that we associate with them a color representing the number of iterations before they diverge, we get a fascinating plot. The shape is so intricate that we can always zoom-in and never go out of finer detail. In fact, the boundary of the Mandelbrot set is a fractal: it means it has an infinite perimeter and finite area. It also means it is nowhere differentiable.
Using Python and Matplotlib's Animation API, we implement and visualize the convergence of the Mandelbrot set as the number of iterations increases. This is illustrated in the animation below:
Animation: The most interesting square of the Mandelbrot set as it converges
The source code related this visualization can be found in this Python Notebook. For more information, please follow me on Twitter.
If you liked what you just saw, it would be really helpful to subscribe to the mailing list below. You will not get spammed that's a promise! You will get updates for the newest blog posts and visualizations from time to time.

Leave a comment