
Visualized Koch Snowflake in Python with Matplotlib
Drawing snowflakes is easy, it only takes to know some simple math. We can mathematically construct a perfect snowflake by following the Koch Snowflake algorithm. It is also known as a Koch curve and it is a fractal line. That means the line shows the same pattern of irregularity regardless of the scale at which we see it. The Koch Snowflake as a closed polygon has a fascinating property of infinite length and finite area.
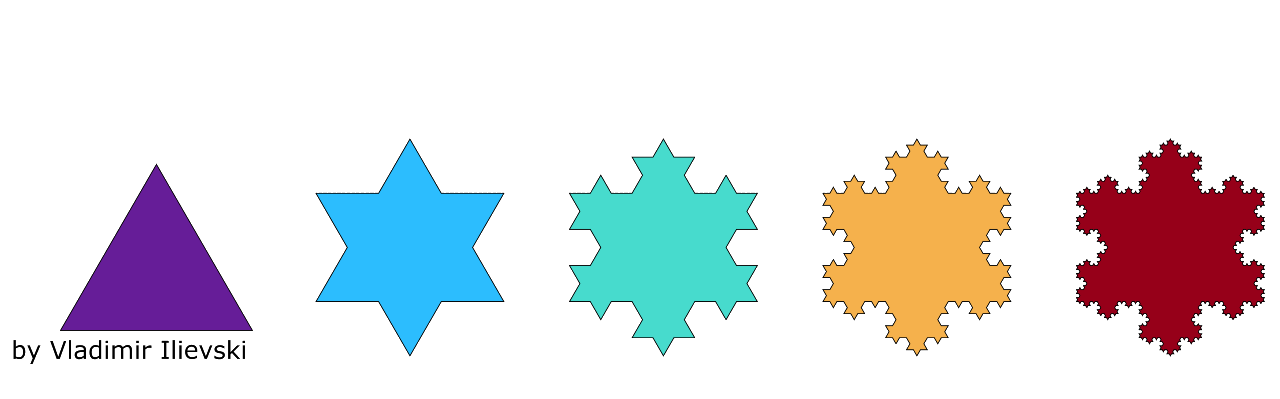
So, how do we construct such an intricating polygon? We start with an equilateral triangle (all sides are equal) and for each line we recursively and infinitely repeat the following steps:
- divide the line in three equal parts
- remove the line in the middle
- draw an equilateral triangle above the removed middle part
To understand this process in a better way, it is always good to make an animated visualization. For this reason, we implement the described algorithm in Python and visualize it using the Matplotlib's Animation API. Thus, the process is perfectly illustrated in the animation below:
Animation: Koch Snowflake Construction
The full source code behind the Koch Snowflake algorithm and the animation above can be found in this Python Notebook.
If you liked this visualization and this way of perceiving the concepts please share it on the social media. You can also subscribe the the mailing list below to be always up to date. You will receive emails from time to time.

Leave a comment