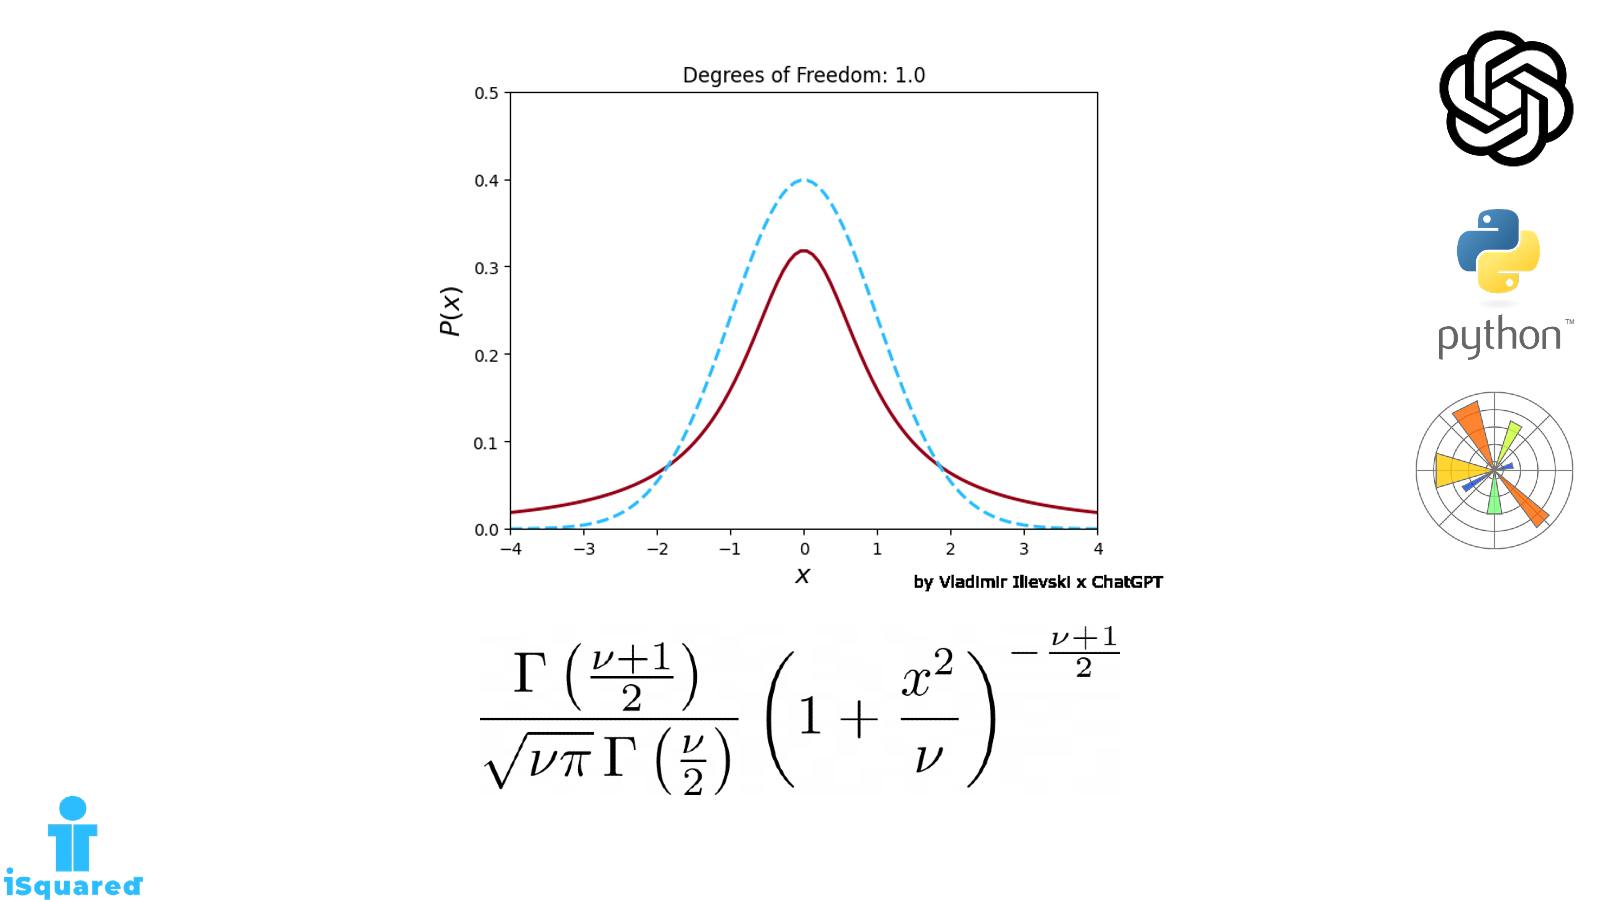
Convergence of T-distribution to Normal Distribution. Visualized!
How the t-distribution approaches the normal distribution as the degrees of freedom increase.

This section focuses on explaining scientific and tech concepts through visualizations. Each guide has three main components:
Enjoy the reading!
How the t-distribution approaches the normal distribution as the degrees of freedom increase.
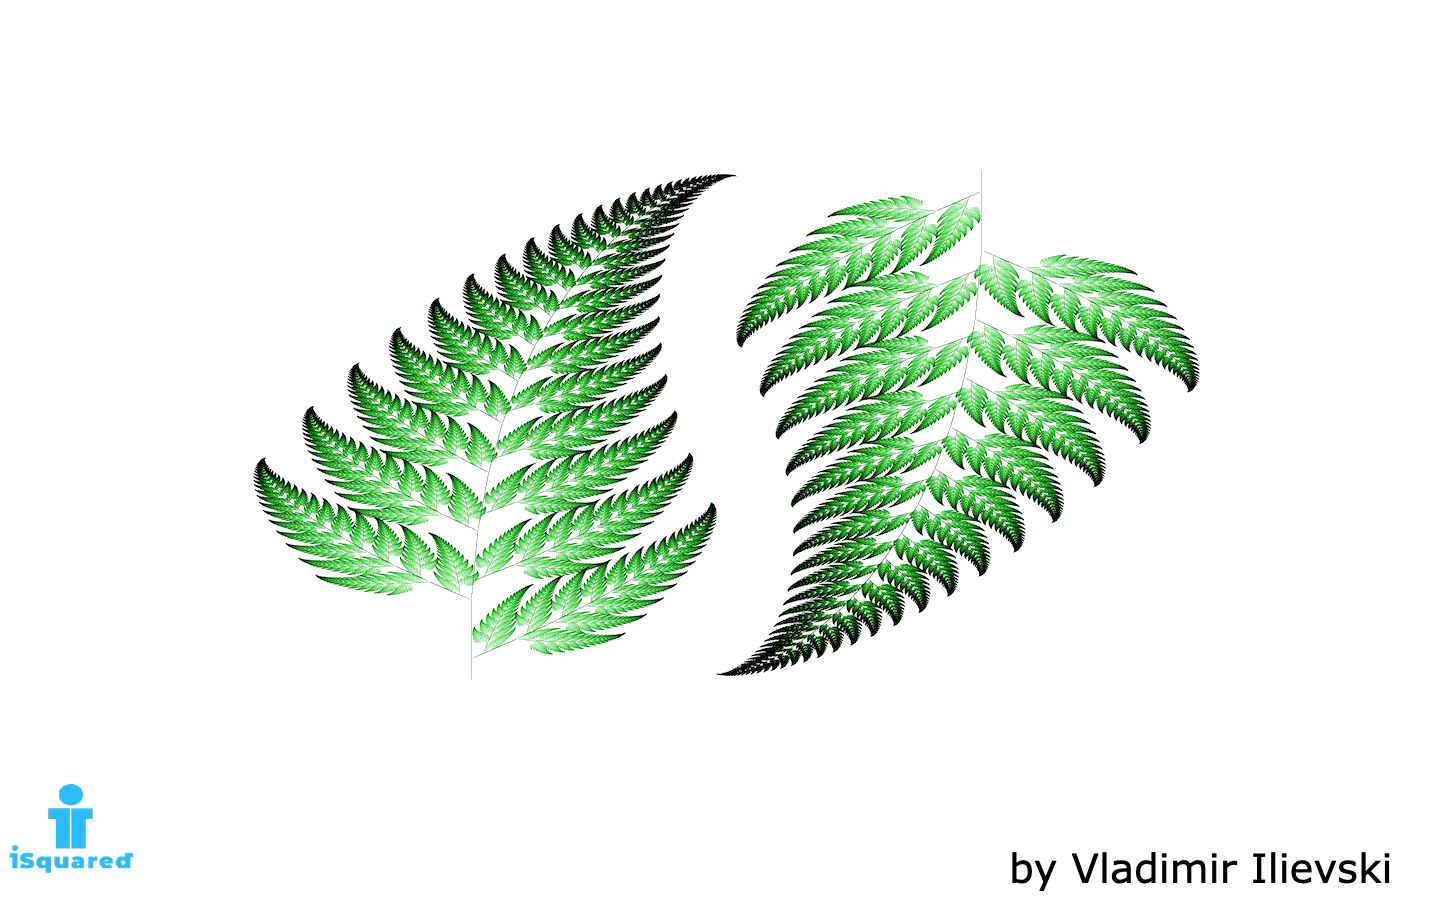
Ferns can also be fractals. Generate and plot the Barnsley Fern fractal in Python using Matplotlib
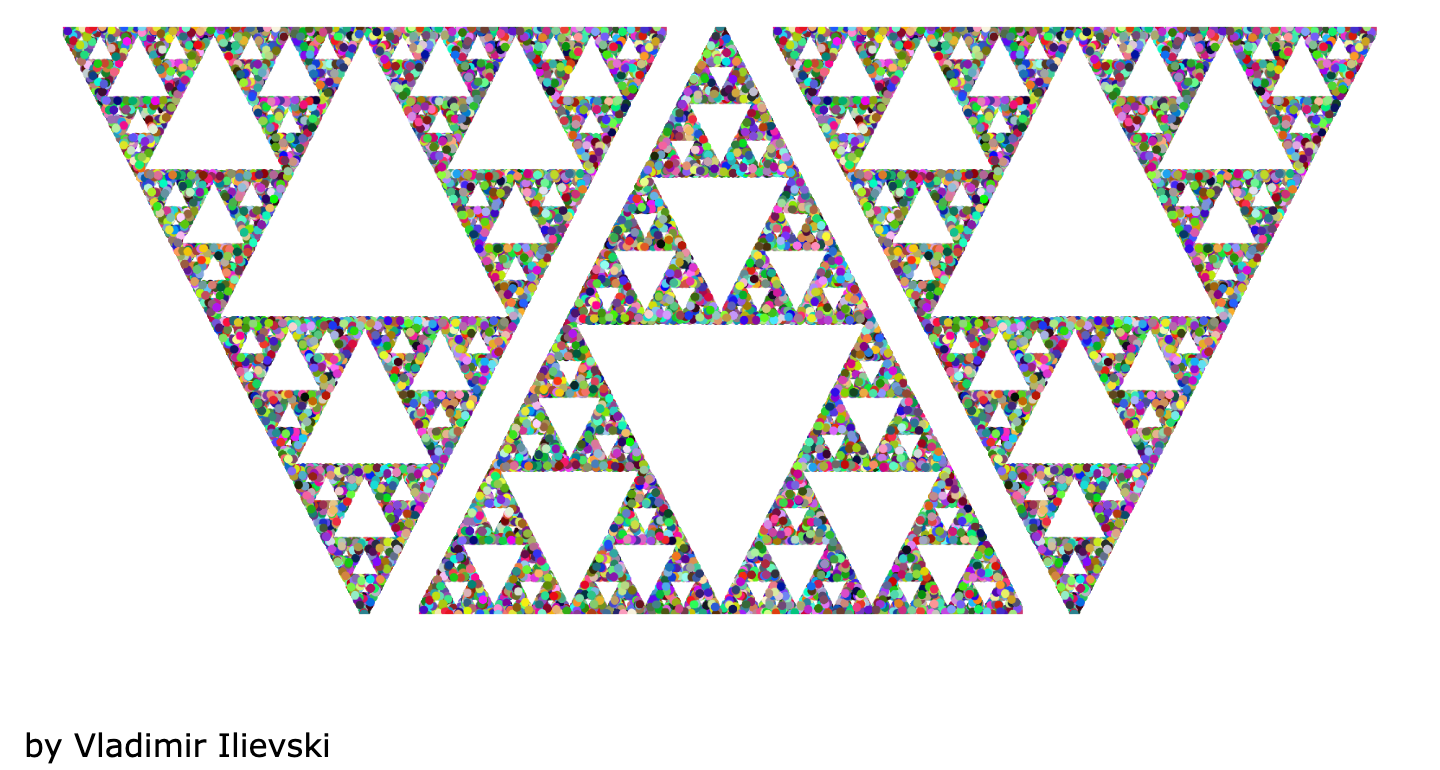
Ho Ho Ho! Mery Christmas!
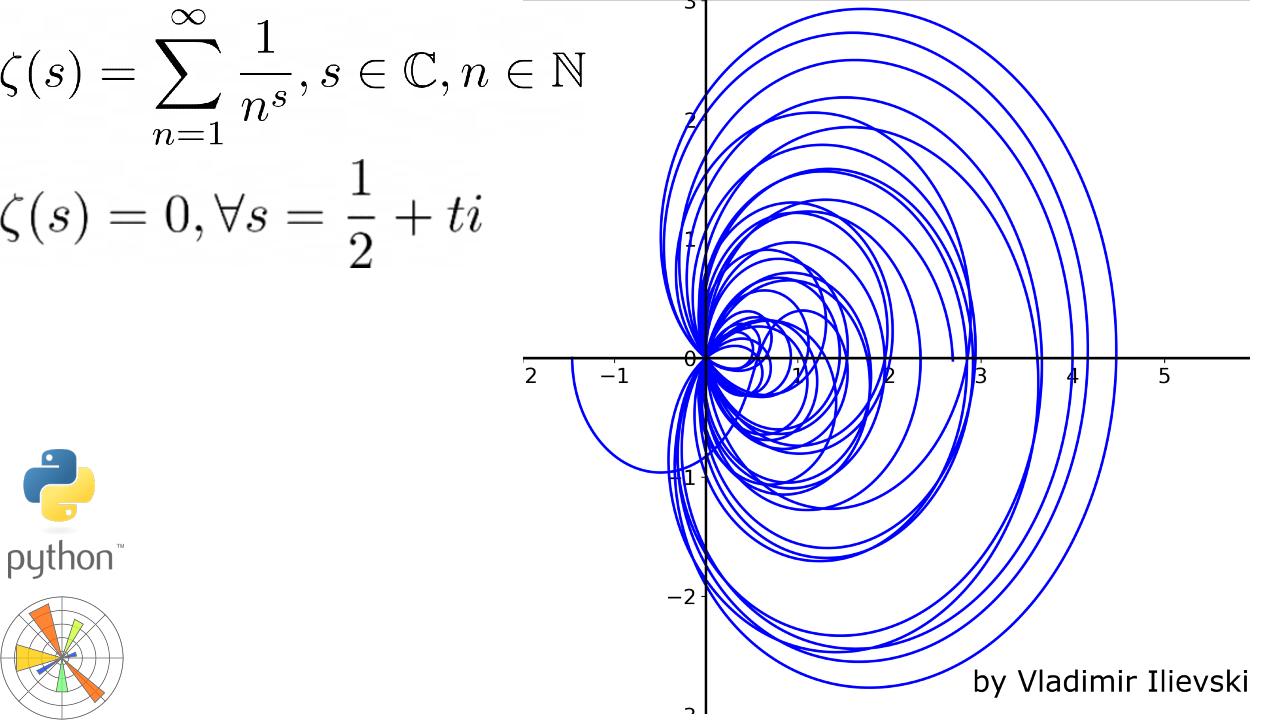
Not an ordinary function, animating the zeros of the Riemann Zeta function in Python using Matplotlib
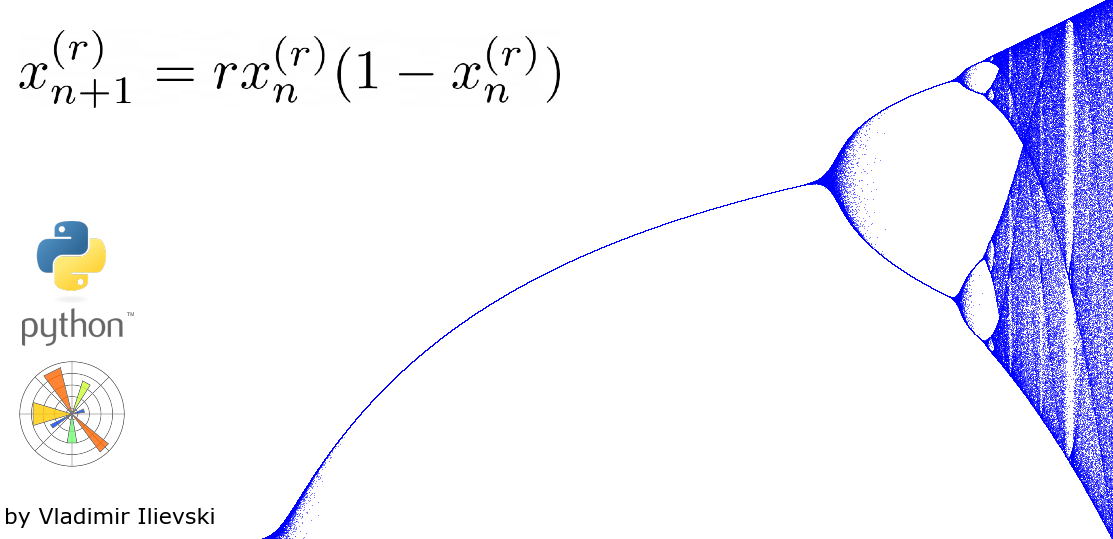
It is strange how seemingly simple things turn out to be so chaotic.
The mind-gobbling properties of the Julia Set through the prism of visualization
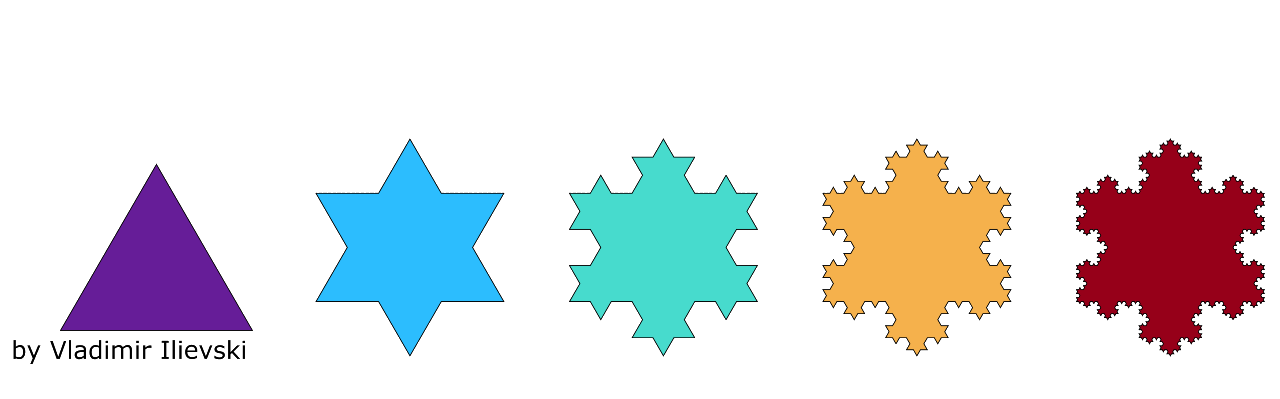
How to mathematically construct a perfect snowflake?
Implement and make a visualization of the Mandelbrot set. All in Python with Matplotlib
How to numerically calculate the area of a circle in Python
Animated Visualization of the Riemann Sums using Matplotlib
Visualization of the Brownian Motion Reflection Principle with Matplotlib
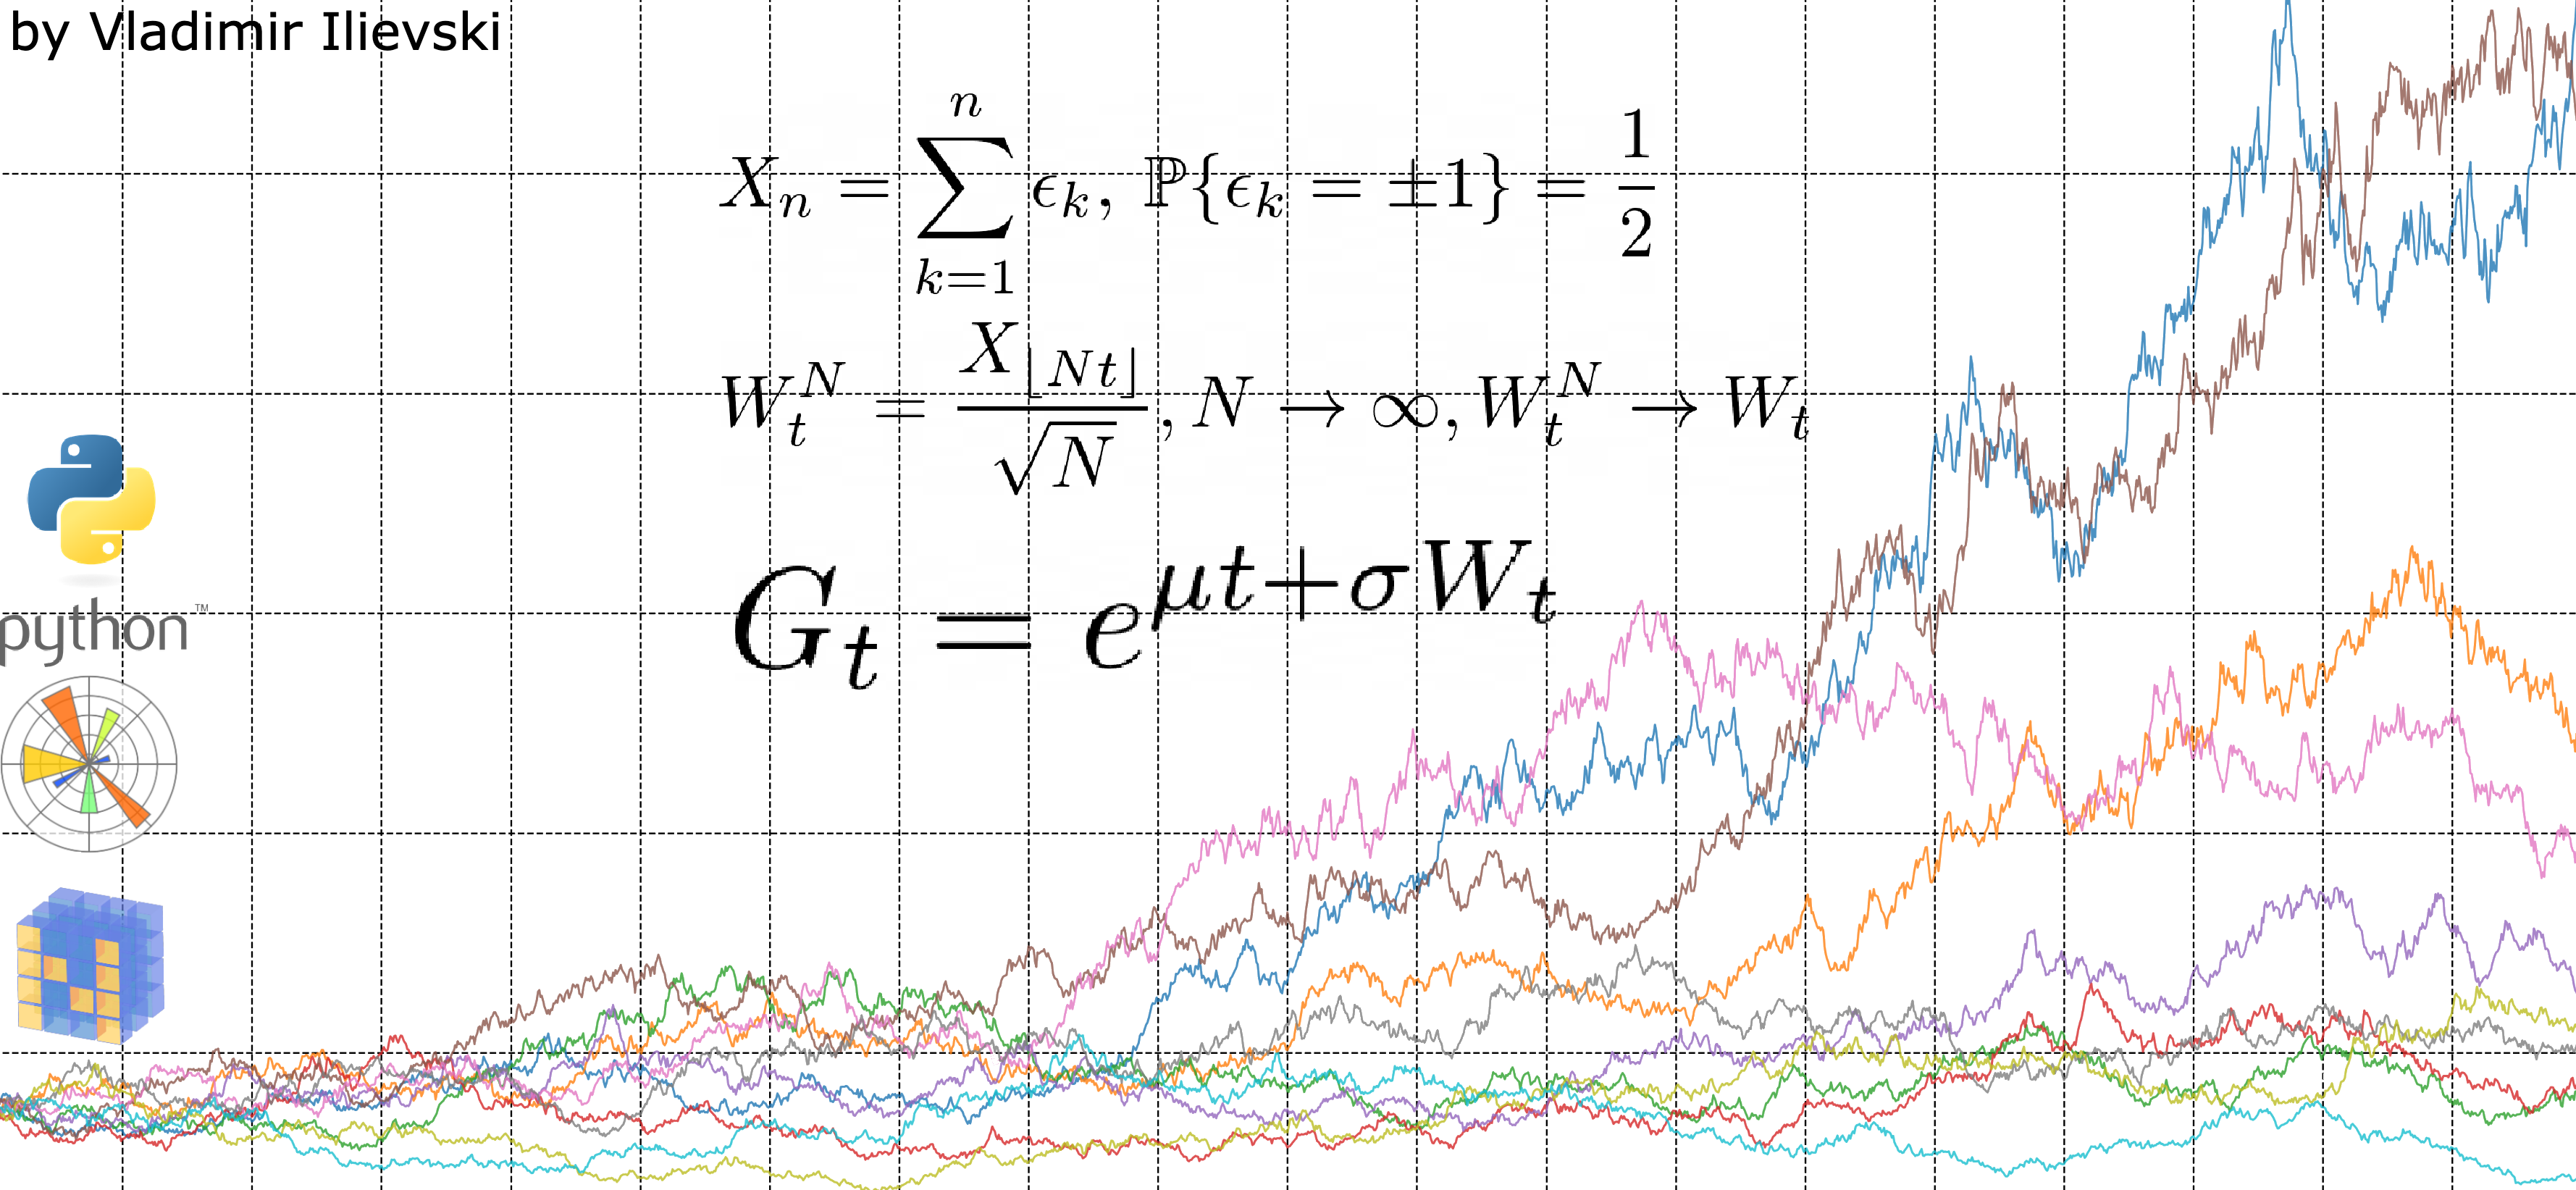
Monte Carlo simulation of a single Geometric Brownian Motion
The Geometric Brownian Motion can have zero mean and infinite variance
Visualized approximation of Pi by randomly drawing points
Animation of Brownian Motion with Volatility with Matplotlib
Animation of Brownian Motion only with Drift with Matplotlib
Convergence of the Simple Random Walk to a Brownian Motion with Matplotlib
Animated visualization of simple random walk with Matplotlib
JDK class dependency as an interactive graph using Cytoscape JS
Laptop Visualizations using Parallel Coordinates plot generated with D3 JS